
Based upon Customs and Border Protection (CBP) statistics and certain knowledgeable people within CBP, most of the drugs entering the United States come through our ports of entry and our government should focus most attention there. But is this the only metric to consider?
The Office of Field Operations (OFO) manages ports of entry, including those on land, sea and at airports. The U.S. Border Patrol (BP) manages all areas between our ports of entry and includes areas along the U.S.-Mexico border. More than seven times the amount of cocaine was seized at our ports of entry than along the border.
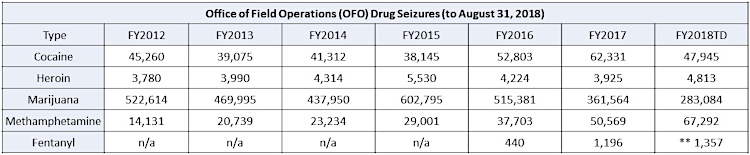
*weights are in pounds (lb)
** Fentanyl statistics reflected here are through July 31. August totals will be provided next month.
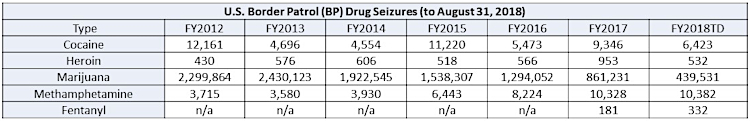
*weights are in pounds (lb)
Additional information provided in the 2018 National Drug Threat Assessment, produced by the Drug Enforcement Administration in October 2018 shows that depending upon the substance, more seizures of heroin are being seized at our ports of entry while more seizures of marijuana are being done between ports of entry.
Regardless of where these seizures are taking place, focusing only on seizures is not the only metric to use when considering extra enforcement at our ports of entry or building more wall along our borders. An alternative way of measuring the need for resources at specific locations might be to use more extensively a measure of effectiveness like TSA does. They use Red Teams to test airport screening in an effort to expose security gaps and keep TSA screeners sharp. This is different from gathering and using total seizure data because this metric does not provide a perspective as to how well OFO or BP are doing at slowing down illegal activity. Moreover, the total seizure metric reminds me of how a statistical analysis dating back to World War II was used when the British were looking at how and why they were loosing so many war planes.
 At that time, the Royal Air Force had lost a lot of planes to German anti-aircraft fire and so they decided to add more armor. But they did not know where to put the armor and the obvious answer was to look at planes that returned from missions, count up all the bullet holes in various places, and then put extra armor in the areas that attracted the most fire. This is the same as measuring the location of total seizures and then deciding how and where additional enforcement is needed.
Adding armor where there were bullet holes was obviously wrong as Hungarian-born mathematician Abraham Wald explained. He suggested that planes that made it back safely and had a lot of bullet holes in the wings meant that bullet holes in the wings were not very dangerous. The more obvious answer was to add armor to the areas that, on average, didn’t have any bullet holes. The logic is that planes with bullet holes in those places never made it back. That’s why you didn’t see any bullet holes there on the ones that did return.
This same logic should be considered at our border. Instead of adding enforcement in areas with the most drug seizures, we need to figure out how most of the drugs have been entering the United States, which is the same as identifying why planes were being shot down by the Germans during World War II. For example, if OFO were able to seize more than 90% of the total drugs crossing, but along our borders, BP was only able to seize 10% of the total, then it might be said that the OFO is being exploited less so than BP. In other words, maybe more resources are needed along our borders than at our ports of entry. Regardless, from a policy perspective, using total drug seizure data should not be the only metric to use when deciding where to put additional resources.